Sapa User Guide
By Daniel Bryce
Sapa Planner by BinhMinh Do
Sapa Planner GUI by Daniel Bryce
Introduction
This document outlines the Graphical User Interface for the Sapa Planner. First,
the input to the planner is described. Then, the output is described. Lastly the
differences between the full application and the applet are explained.
This document does not serve as a description of the Sapa Planner <see
http://rakaposhi.eas.asu.edu/sapa/
for planner details>.
Input
The input minimally consists of a domain file and problem file. Additional
options can be selected to customize the planning. Once the input is specified,
then the planner may be started.
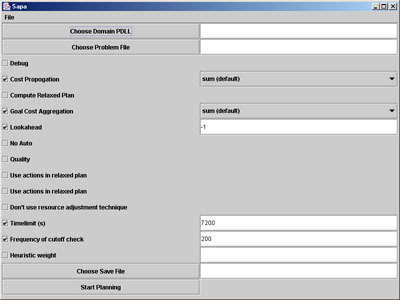
 Figure 1: Input Screen
- Domain File (PDDL)
* Click 'choose domain' and use file chooser to pick a PDDL
file
- Problem File
* Click 'choose problem' and use file chooser to pick problem
file
- Sapa Options
Debug: Print detailed problems, domains, actions information
Cost Propagation Option: 0-max; 1-sum (default); 2-Combo
Don't compute the relaxed plan
GoalCost Aggregation Option: 0-max;
1-sum(default); 2-Combo
Lookahead option. Default: lookahead = -1
No Auto: Do not use the *auto* running option (auto switch
between option) -quality Try to improve the quality after found first solution
(with different options) -ha Using actions in the
relaxed plan (auto = false)
Using the set of negative effects of actions in the relaxed
plan (auto=false)
Do not use the resource adjustment technique
Time cutoff in seconds (to stop the program)
Frequency to check the time cutoff limit (e.g number of
generated search nodes)
Weight given to the h value (heuristic = g + hw*h)
Output file for the solution.
Start Planning - Click after at least the Domain and Problem files are
selected.
Output
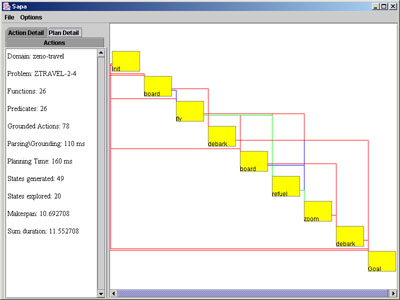
The output consists of a Chart area to graphically depict the plan, an Action
list to denote the actions, an action detail area, and a plan detail area.
Further, the output can be altered by selecting various options from the options
menu, on the menu bar.
- Chart Area
 Figure 2: Plan
Detail and Pert Chart
* Default display is a Gantt chart with redundant ordering realtions removed,
and all other relations present.
* Clicking on an action's cell will highlight the action red, the preceding
actions green, and the post actions pink. Pre/Post actions are related to the
selected action by at least one relation.
- Options
 Figure 3: Display
Options
* Show Causal Links - Default true.
* Show Resource Mutex - Default true.
* Show Predicate Mutex - Default true.
* Show Unit Actions - Default false. A Pert chart is similar to a Gantt chart,
the only difference is that all action cells are the same unit size.
 Figure 4: Action
Highlighting on Pert Chart
* Remove Redundant Orderings - Default true.
- Detail Area
Key Commands: +/- to zoom , and q to quit.
* Actions - list of actions and the index assigned to them by the planner. The
index does not indicate ordering, just notation.
* Action Detail - If an action is highlighted in the Action list, or within the
chart area, then the detailed information regarding the action is present in
this tab.
 Figure
5: Action Detail for a Gantt Chart
+ Index
+ Name
+ Start Time
+ End Time
+ Duration
+ Objects - Objects involved in Action
+ Pre Relations - Action name and relation type
+ Post Relations - Action name and relation type
* Plan Detail - Information about the Plan